Documentation
Why?
You can’t be serious…another web performance testing tool? You’re right to roll your eyes, but give us a chance to justify why we made whambam.
$ brew doctor
Warning: Some installed formulae are deprecated or disabled.
You should find replacements for the following formulae:
    hey
$ brew info hey
==> hey: stable 0.1.4 (bottled)
HTTP load generator, ApacheBench (ab) replacement
https://github.com/rakyll/hey
Deprecated because it is not maintained upstream! It will be disabled on 2026-01-12.
Wait, what? But we love hey! That’s too bad.
We looked around and there are more web testing tools than you can imagine. But it’s hard to find a tool that’s a good replacement for hey, which has the ideal mix of speed, simplicity, and features.
Although one of the things we liked looking at alternatives was a way to see progress. We’re not signing up for a full UI, but can we do something simpler and still have it feel like a terminal application?
We gave it a shot and we hope you like what we came up with.
Here’s our design and implementation focus.
- As fast as
hey - Command-line argument compatibility with
hey - A simple progress UI
- A cleanroom implementation
Install
brew install cloudy-native/whambam/whambam          # macOS and Linux
cargo binstall whambam                              # prebuilt binary via cargo-binstall
cargo install whambam                               # from source
scoop install https://github.com/cloudy-native/whambam.dev/releases/latest/download/whambam.json   # Windows
Every GitHub release has binaries for macOS, Linux (glibc and static musl) and Windows, each on x86_64 and ARM64, plus Debian packages and SHA-256 checksums.
Usage
Get started with whambam by pointing it at a URL and letting good defaults do the rest.
whambam -z 10s https://example.comWill pummel https://example.com for 10 seconds with the default 50 concurrent connections.
Load Options
| Option | Description | Default | Examples & Explanation |
|---|---|---|---|
-n, --requests <N> | Number of requests to send | 200 | -n 10k sends exactly 10,000 requests (k and m suffixes work). -n 0 runs until you stop it. Ignored when -z is set. |
-c, --concurrency <N> | Workers (concurrent connections) | 50 | -c 100 uses 100 workers. --concurrent also works. |
-z, --duration <TIME> | Run for a time instead of a count | – | -z 1m, -z 30s, -z 500ms. Takes precedence over -n. |
-t, --timeout <TIME> | Per-request timeout | 20s | -t 5 or -t 500ms. 0 means no timeout. |
-q, --rate-limit <QPS> | Rate limit per worker, as in hey | unlimited | -q 100 aims for ~100 requests/sec per worker. Total ≈ -q × -c. |
--qps <QPS> | Total request rate, latency corrected | – | --qps 500 schedules 500 requests/sec across all workers and times each request from when it was due. See below. |
-p, --http2-parallel <N> | HTTP/2 streams per connection | 1 | --http2 -c 4 -p 10 runs 40 workers over 4 connections. |
Rate limits and coordinated omission
With -q, each worker waits for its next tick, sends, and waits for the response, just like hey. If the server stalls, workers send fewer requests, and the slow period is under-represented in the results. This is called coordinated omission.
With --qps, requests are scheduled at a fixed total rate. If every worker is busy when a request is due, it waits, and that wait is included in its latency. Percentiles then show what real clients arriving at that rate would have seen. The report says when latencies are corrected.
Request Options
| Option | Description | Default | Examples & Explanation |
|---|---|---|---|
-m, --method <METHOD> | HTTP method | GET | -m POST. Any valid method token is accepted. |
-d, --body <BODY> | Request body | – | -d '{"key":"value"}' |
-D, --body-file <FILE> | Request body from a file | – | -D body.json. Binary files are sent unchanged. |
-H, --header <HEADER> | Custom header (repeatable) | – | -H 'X-My-Header: 123' -H 'Authorization: Bearer abc' |
-A, --accept <TYPE> | Accept header | – | -A 'application/json' |
-T, --content-type <TYPE> | Content-Type, sent with a body | text/html | -T 'application/json' |
-a, --auth <USER:PASS> | Basic authentication | – | -a admin:s3cr3t |
--host <HOST> | Override the Host header | – | --host api.internal |
-U, --user-agent <UA> | User-Agent | whambam/<version> | -U 'Mozilla/5.0' |
Connection Options
| Option | Description | Examples & Explanation |
|---|---|---|
-x, --proxy <PROXY> | Proxy | -x 127.0.0.1:3128 or -x socks5://127.0.0.1:1080 |
--http2 / --http-version 2 | Use HTTP/2 | Uses ALPN on https:// and prior knowledge (h2c) on http://. |
-k, --insecure | Accept invalid TLS certificates | For self-signed test servers. |
--cacert <PEM> | Extra CA certificate | Trusted in addition to the system store. |
--cert <PEM> --key <PEM> | Client certificate (mutual TLS) | Both are required together. |
--connect-timeout <TIME> | Connection timeout | --connect-timeout 2s |
--connect-to <H:P:H2:P2> | Redirect a host and port | --connect-to example.com:443:10.0.0.5:8443 tests one backend while keeping the Host header and TLS name. |
-4, --ipv4 / -6, --ipv6 | Address family | Resolve names to IPv4 or IPv6 addresses only. |
--disable-compression | Disable compression | Don’t request gzip, brotli, deflate or zstd. |
--disable-keepalive | Disable connection reuse | A new connection for each request. |
--disable-redirects / -r, --redirect <N> | Redirect limit | Default 10. --disable-redirects is -r 0. |
Output Options
| Option | Description | Default |
|---|---|---|
--no-ui (alias --no-tui) | No interactive UI | off |
-o, --output-format <FMT> | text, json, csv or quiet | text |
--output <FILE> | Write the report to a file | stdout |
--debug | Send one request and print the request and response | – |
--no-color | No colors (also honours NO_COLOR) | – |
--fps <N> | UI refresh rate | 10 |
Progress while the test runs is written to stderr; the report goes to stdout so you can pipe or capture it cleanly. When stdout isn’t a terminal, whambam skips the UI automatically. After you quit the UI, the report is printed too.
whambam https://example.com -n 200 -c 50 --no-ui
whambam https://example.com -z 10s -c 50 --no-ui > report.txt
whambam https://example.com -z 10s -o json --output report.json
whambam https://example.com -n 1k -o csv --output requests.csv- JSON is a summary: target, load settings, totals, latency statistics and percentiles, histogram, status codes and errors by kind. The shape is defined by a JSON schema.
- CSV has one row per request:
offset_s,latency_ms,status,error,bytes_received. With the UI running, CSV needs--output FILE.
Text report accuracy
The report is hey-inspired for familiarity, but accuracy is preferred over matching hey’s layout or numbers.
| Metric | How it is computed |
|---|---|
| Average | True mean of all latency samples (HDR histogram mean) |
| Histogram | Real sample counts from the HDR histogram (linear buckets) |
| Latency 10%…99.9% | HDR quantiles of those samples |
| Fastest / Slowest | Observed min / max |
| Success rate | Responses with status below 400 |
| RPS, Total data, Size/request | Completed requests, wall time, byte counters |
| Status codes | Observed codes |
| Error distribution | Transport errors grouped by kind: timeout, dns, connection refused, connection closed, tls, … |
Omitted on purpose: hey’s “Details” block (DNS+dialup, DNS-lookup, req write, resp wait, resp read). whambam does not instrument those phases and will not invent placeholders.
Latency definition: end-to-end, from request start through full response body download (not headers-only / TTFB).
Debugging a request
--debug sends a single request and prints both sides, which is handy for checking headers, auth and bodies before a long run:
whambam https://httpbin.org/post -m POST -d '{"a":1}' -T application/json --debugLive load controls
You don’t have to restart a test to try a different load. While it runs:
| Key | Effect |
|---|---|
+ / - (or ↑ / ↓) | 10% more or fewer workers |
] / [ | 10% higher or lower rate (--qps total, or -q per worker) |
Start low and raise the load until latency turns: that point is your service’s knee. Every change is drawn as a marker on the charts and listed in the report (Load changes: in text, adjustments in JSON). With --qps, a new rate applies straight away; requests that were queued under the old rate are re-timed.
Baselines and checks
Save a run as JSON, then compare later runs with it:
whambam https://staging.example.com -z 30s --qps 200 --no-ui -o json --output baseline.json
whambam https://staging.example.com -z 30s --qps 200 --baseline baseline.json
With --baseline, the dashboard shows each number’s change from the baseline (red when worse), the Charts tab draws the baseline throughput and mean latency as reference lines, and the report ends with a comparison table.
--assert turns a run into a pass/fail check: whambam exits with status 1 if any check fails, which fails a CI job.
whambam https://staging.example.com -z 30s --assert 'p99<250ms,errors<1%'
whambam https://staging.example.com -z 30s --baseline baseline.json --assert 'p99<+10%,rps>-5%'| Metric | Values | Examples |
|---|---|---|
p50 p90 p95 p99 p99.9 mean min max | latency: 200ms, 1.5s (bare numbers are ms) | p99<200ms, max<=2s |
rps | requests per second | rps>=1000 |
success, errors | percent of requests | errors<0.5%, success>=99.9 |
| any | change from the baseline: +N% or -N% | p99<+10%, rps>-5% |
To compare two saved reports without running anything:
whambam compare baseline.json today.json --assert 'p99<+10%'GitHub Action
The repository is also a GitHub Action. It installs the right whambam binary for the runner, runs the test, writes a JSON report, adds a summary table to the job page, and fails the job when a check fails:
- uses: cloudy-native/whambam.dev@v1
  with:
    url: https://staging.example.com/health
    args: -z 30s -c 20 --qps 200
    assert: p99<250ms,errors<1%
    baseline: baseline.json   # optional: compare with a saved report
    report: whambam-report.json
Local testing
You do not need Node’s http-server. Python’s built-in server works on macOS, Linux and Windows:
# Terminal 1: serve the current directory on port 8080
python3 -m http.server 8080

# Terminal 2: load-test it
whambam http://localhost:8080 -n 100 -c 10
Interactive UI Guide
The interactive UI gives real-time feedback on your load test. Use these keys to navigate:
Navigation
1,2,3,←/→orTab: switch between Dashboard, Charts, and Status & errorshor?: toggle help+/-or↑/↓: more or fewer workers while the test runs]/[: higher or lower rate while the test runs (with--qpsor-q)r: run the same test again after it completesq,EscorCtrl-C: quit and print the report
The header shows the URL, elapsed time, progress, and the load settings (workers, HTTP version, pacing).
Dashboard Tab
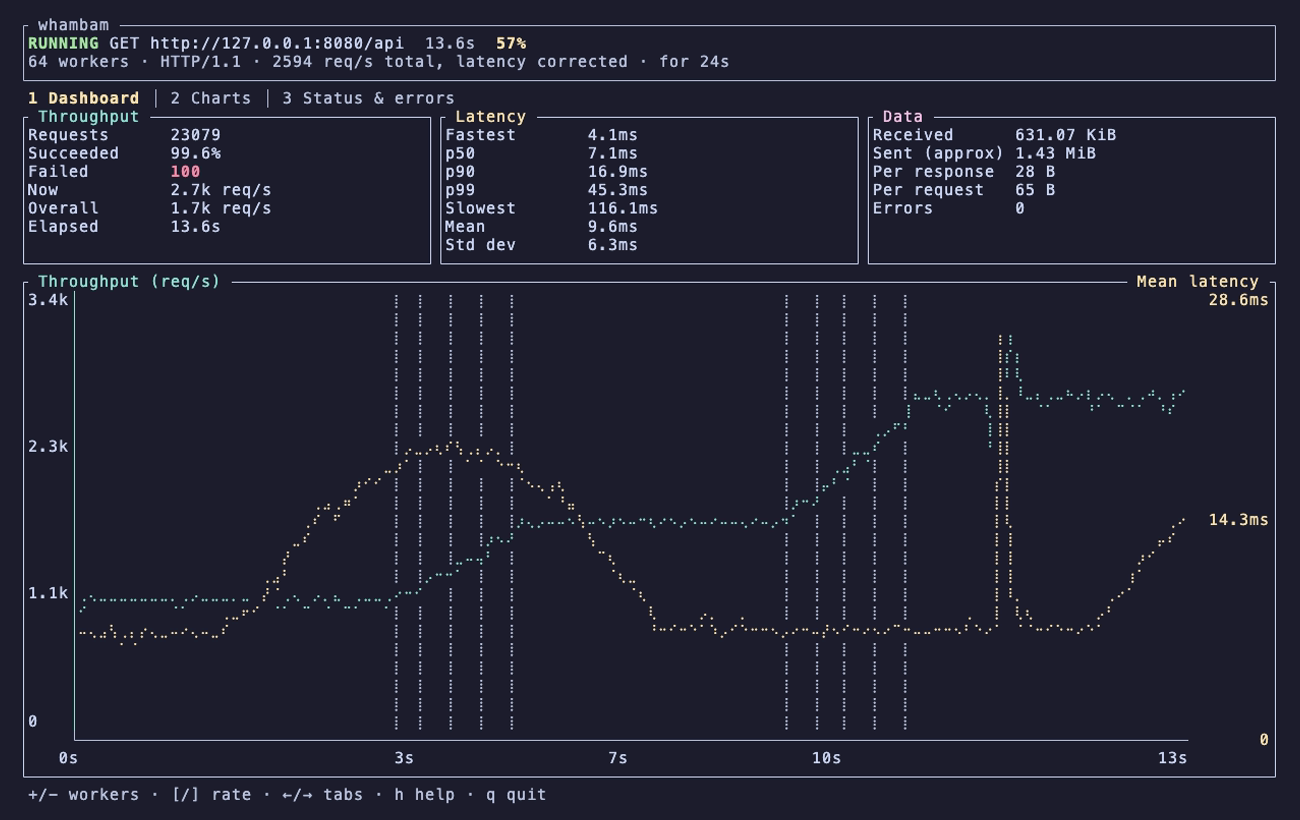
- Throughput: requests, success rate, failures, current and overall requests per second
- Latency: fastest, p50, p90, p99, slowest, mean and standard deviation
- Data: bytes received and sent, per-request sizes, transport errors
- Combined chart: throughput (left scale) and mean latency (right scale) on one timeline, so spikes line up
Charts Tab
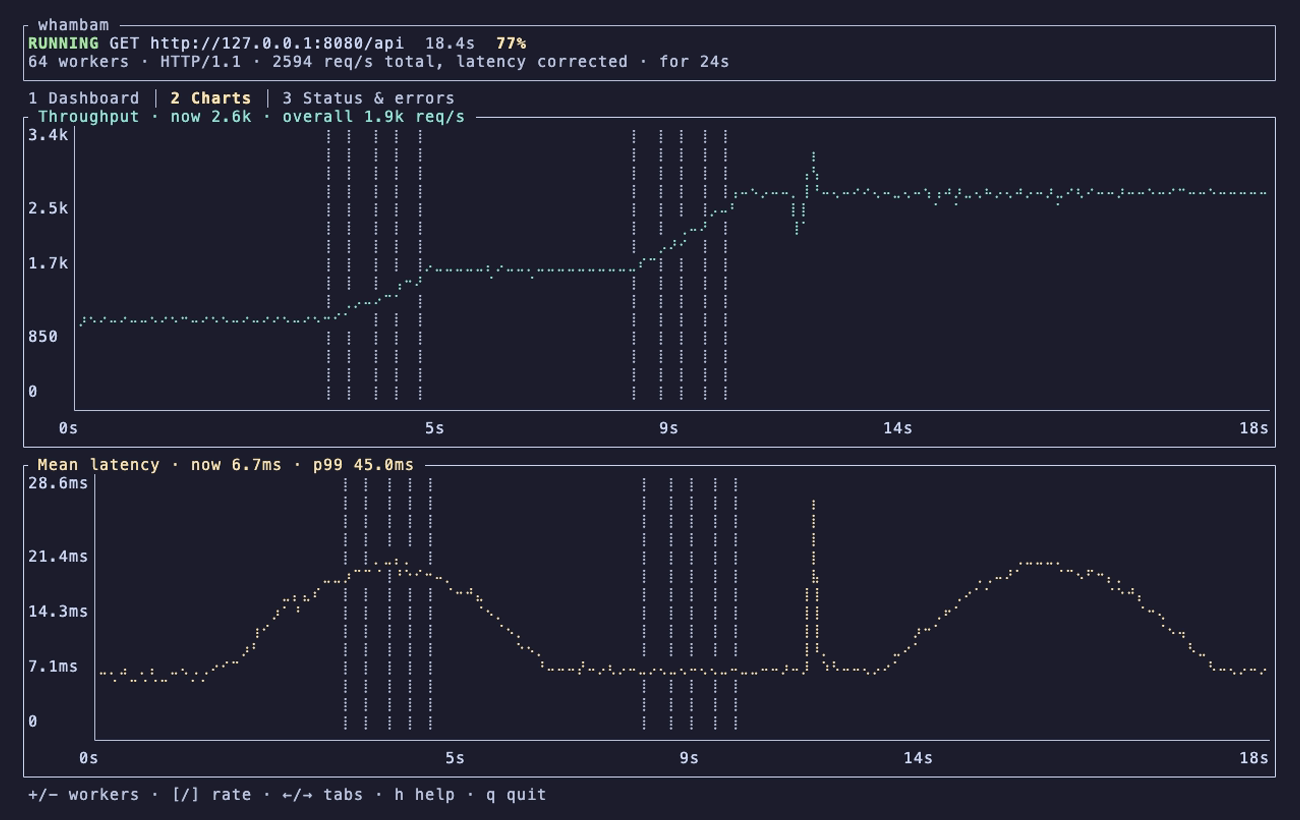
Full-size throughput and mean-latency charts, sampled every 100 ms.
Status & Errors Tab
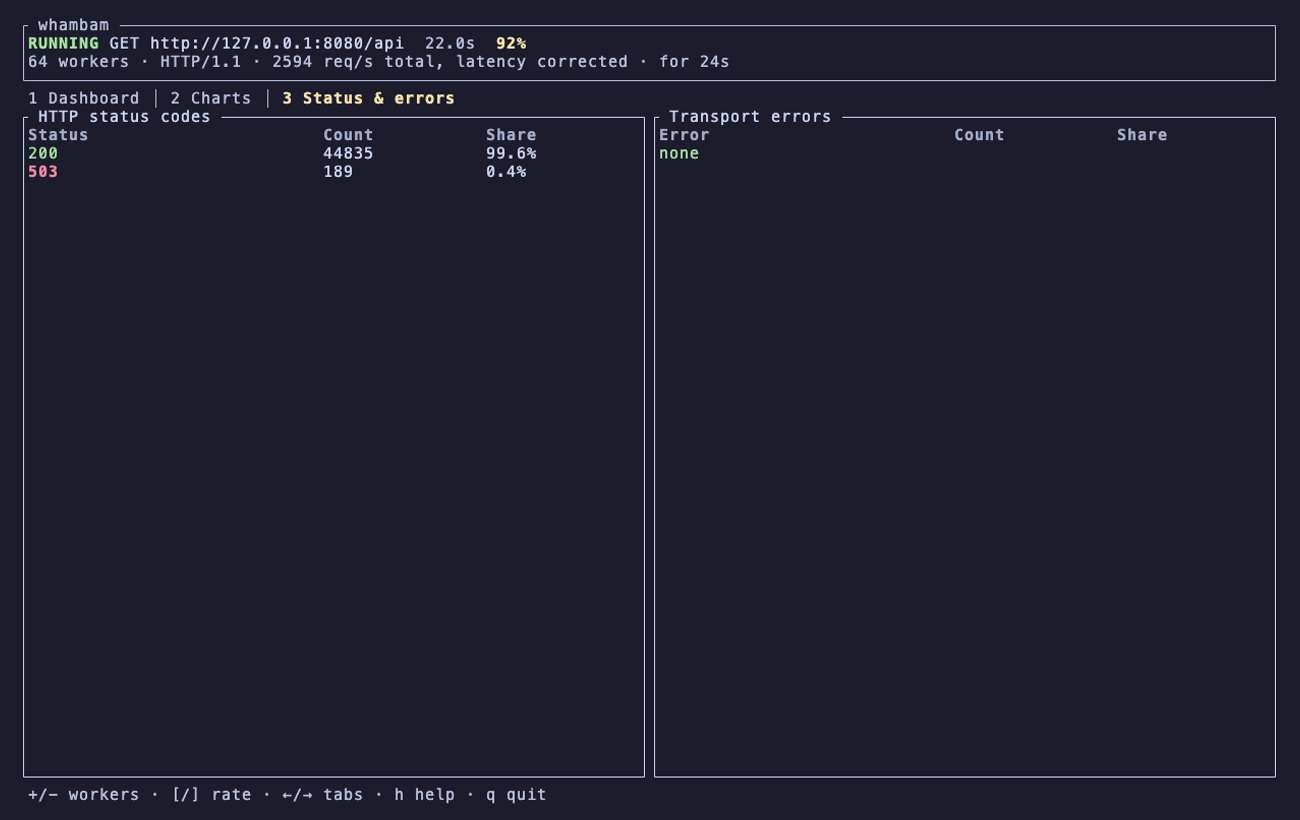
- HTTP status codes, color-coded by class (2xx, 3xx, 4xx, 5xx), with counts and shares
- Transport errors by kind, with counts and shares